Author: Alex Kaddah / Analytics Logics
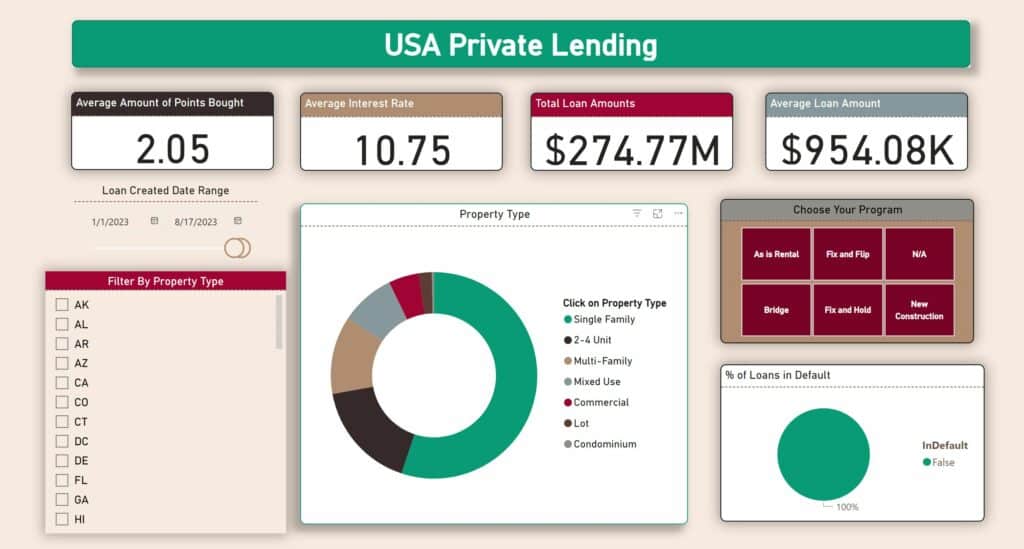
In this article, I will delve into the recent trends within the private lending sector over the past quarter, encompassing the entire country, while also shedding light on specific states. The Analytics Logics ecosystem empowers users to access this real-time information, updated nightly. This capability enables users to make well-informed, data-driven decisions to bolster their organizational choices.
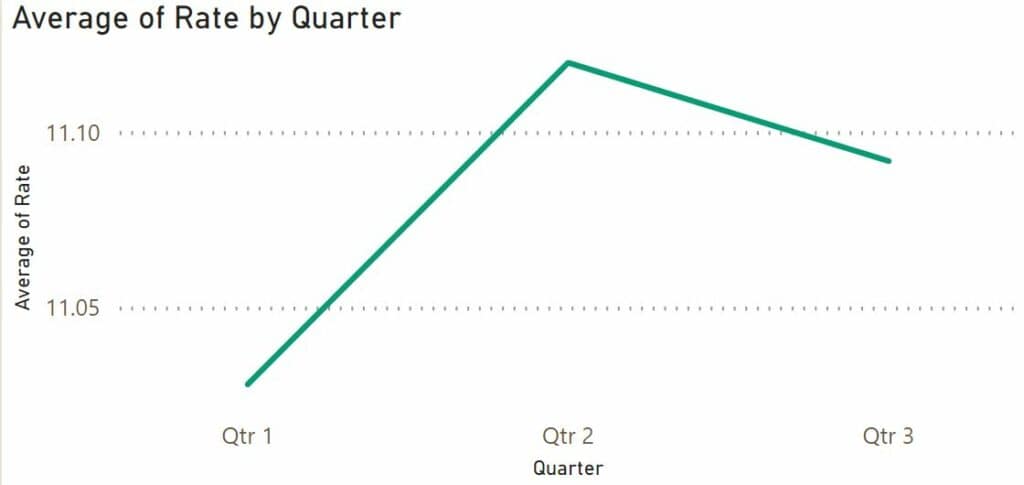
To begin, let’s examine the United States as a whole. Interest rates experienced a growth of over 10 basis points from Q1 to Q2. As Q3 commenced, we observed a slight decrease in rates, albeit only by a couple of basis points. It will be prudent to monitor the trajectory for the rest of the quarter, which will be covered in our upcoming market update article at the start of October.
The Loan-to-Value (LTV) ratios for loans have, for the most part of 2023, exhibited stability, with a hovering average around 0.64 for the entire country.
Analytics Logics provides the capability to not only analyze nationwide trends but also to access real-time information about any desired state or region. In the following sections, I will juxtapose the performance of two major markets during the second quarter of this year.
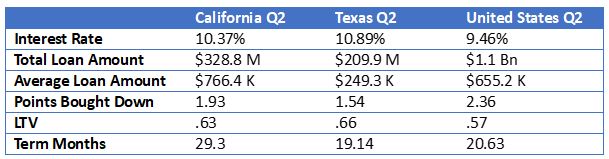
Through these insightful comparisons, it becomes evident that both of these states surpass the national average for interest rates. This observation raises an intriguing question: despite having higher interest rates, can we perceive these two states as some of the most vibrant markets? The concentration of these states in terms of business strategies adds another layer of intrigue; California boasts an impressive average loan amount of over $750K, whereas Texas maintains a more modest average of $250K.
It’s worth noting that although Texas sees a higher volume of loan transactions compared to California, the latter boasts a superior total loan amount. The evolution of these figures as we approach the conclusion of Q3 within the next six weeks promises to be captivating.
Analytics Logics emerges as a fully interactive online service, affording users the freedom to dissect data and compare trends according to their preferences. The platform not only provides graphs for the current year but also grants access to data encompassing a staggering $27 billion in industry loans since 2017. This rich historical perspective enables businesses to comprehend the ebb and flow of trends, thereby gaining a clearer understanding of their current standing within the industry.
Stay Informed About Private Lending

